


For those of you who don’t know me, my name is Brendan Browne and the above photo depicts how I used to feel after intake meetings. You know the drill: you get a laundry list of skills, expertise, and experience required for a job, and run back to your desk to discover that exactly zero people are qualified.
That’s why my team set out early last year to master data-driven recruiting. Today, I shared the results, lessons learned, and best practices from our year-long pilot with hundreds of sourcers and recruiters at SourceCon (big thanks to Jeremy Roberts and the folks at ERE Media for giving me such a great opportunity).
If you’re interested in reviewing all our lessons learned and best practices, check out the new Data Driven Recruiting ebook we just published. If you prefer cliff notes, here is a brief overview of how our new recruiting methodology works:
1. Show the hiring manager the size of the addressable talent pool
Here is an example of a search we ran for a Data Center Operations Manager:
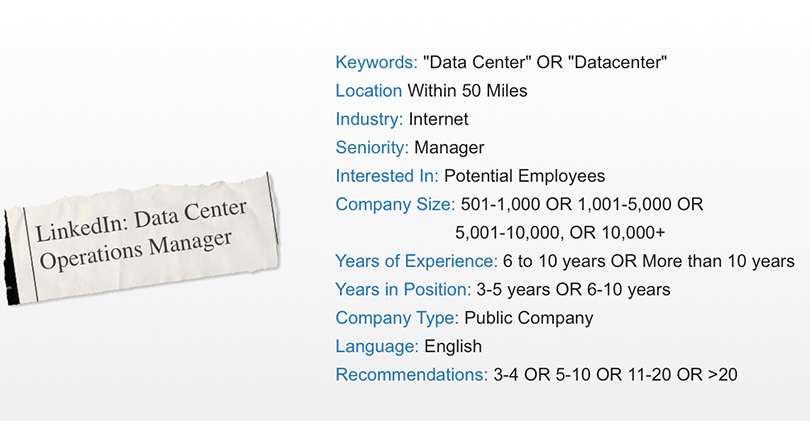
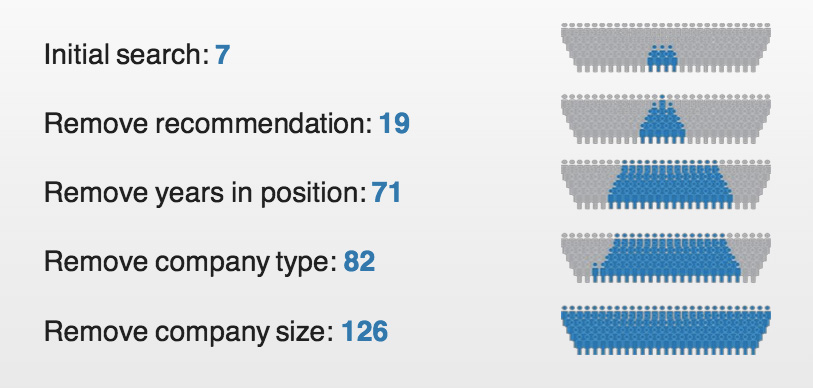
Not surprisingly, only 7 people met the search criteria. The hiring manager needed to know that, so we started running the searches with hiring managers in real-time. Then we showed them how removing one or two of the “must haves” expanded the talent pool:
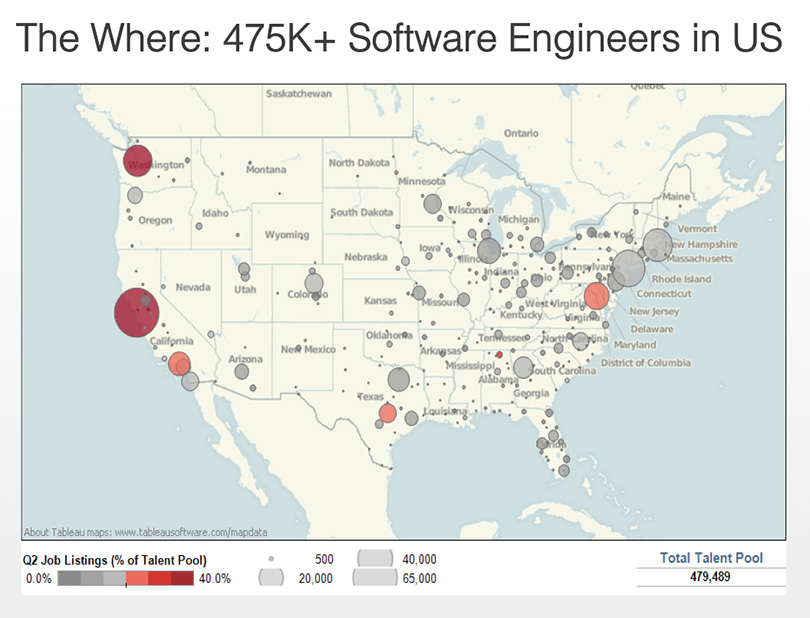
2. Find the hidden gems
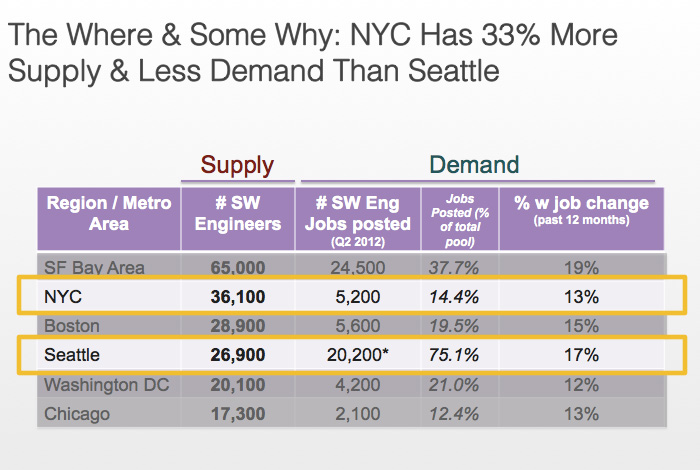
If every company recruits from the same talent pool, some companies will win; most wont. That’s why it’s critical that recruiters identify hidden pools of talent. We used LinkedIn talent pool data to see where engineers lived (you can access talent pool data by contacting your LinkedIn account manager or check out these publicly-available reports):
Then we pinpointed the “hidden gems” – cities that had sizeable pools of engineers that were in low demand.
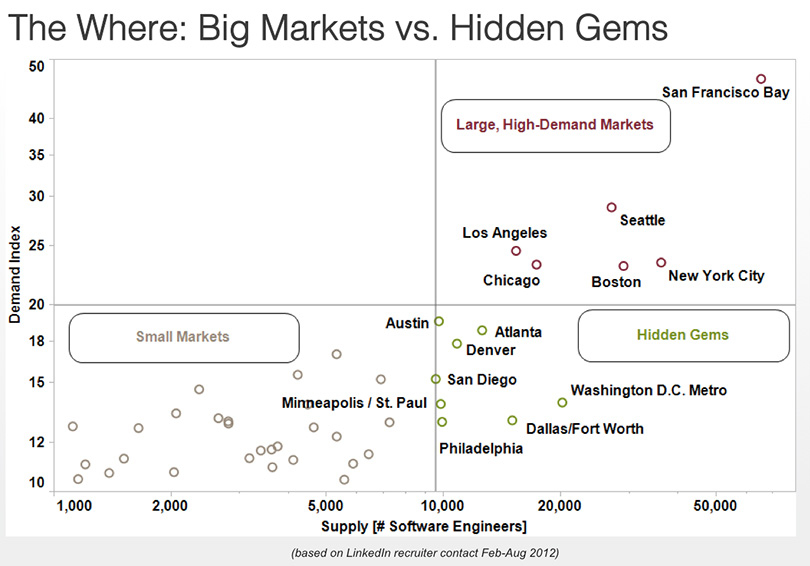
This was a crucial step because it made us realize that New York City had 33% more supply and less demand for engineers than Seattle:
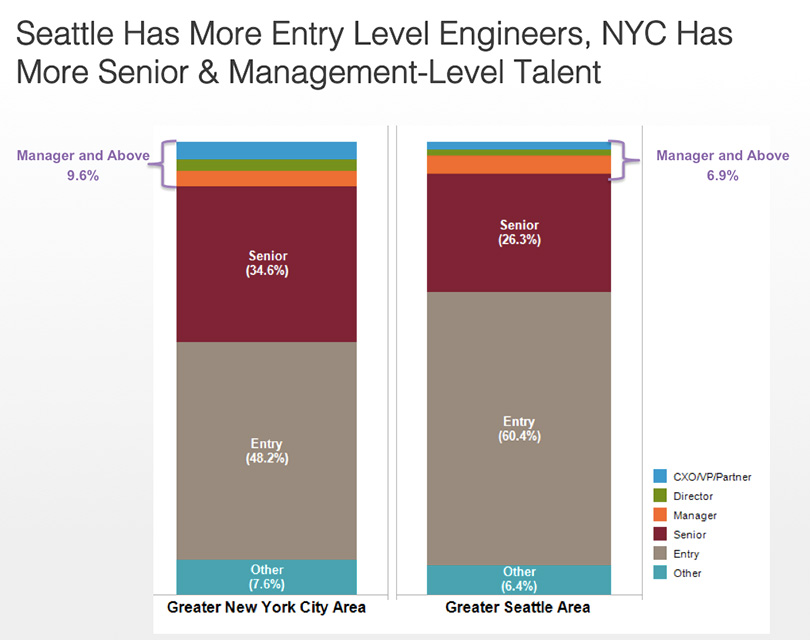
3. Find the seniority and skills breakdown of talent by location
Once we’d identified where the hidden gems were, we drilled down on the different engineer skill sets in NYC and Seattle by seniority levels:
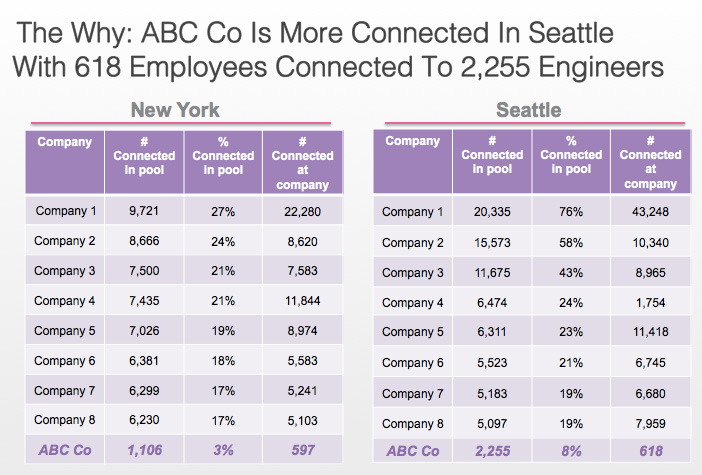
4. Figure out how connected your employees are to the prospects you're eyeing
Before we started reaching out to prospects in NYC and Seattle, we wanted to check which market would be more receptive to messages from our company. One of the easiest ways to predict that was seeing what percentage of engineers in that market are connected to our employees. Network connections like that make it 21% more likely that prospects would know about the company and 10% more likely that they will consider a job with us. Absolutely worth the extra effort.
In fact, looking at the network connectedness data made us shift our plan – engineers in Seattle were much better connected to our employees and hence more likely to be receptive to our messages.
This recruiting method blew away our other recruiting channels -- referrals, campus recruiting, general applicants, etc. Our InMail response rates more than tripled, we reached our highest conversion rates for applicant-to-onsite and applicant-to-offer, and we had our most successful engineering recruiting quarter ever. And the icing on the cake: since our outreach was so targeted, our engineering team spent less time interviewing and more time building new products.
And I pretty much look like this every day:
How does your team use data to make better decisions?

To receive blog posts like this one straight in your inbox, subscribe to the blog newsletter.

Topics: Talent analytics Recruiting tips
Related articles